Image Galleries
Our image galleries are a window into a world of sector-changing science. Take a look at the way that our technology impacts some of the most important scientific pursuits on the globe.
Cell Proliferation
Cell Proliferation
IncuCyte ZOOM® HD-phase contrast images (10x) of A549 cells treated with Vehicle control, Camptothecin (CMP, 1 micro-molar) or Doxorubicin (Dox, 100 nM). The same number of cells were seeded per well and achieved the same confluence (40%) at 0h prior to treatment. Images taken 48h post treatment. Note the striking differences in cell morphology following compound treatment compared to control.

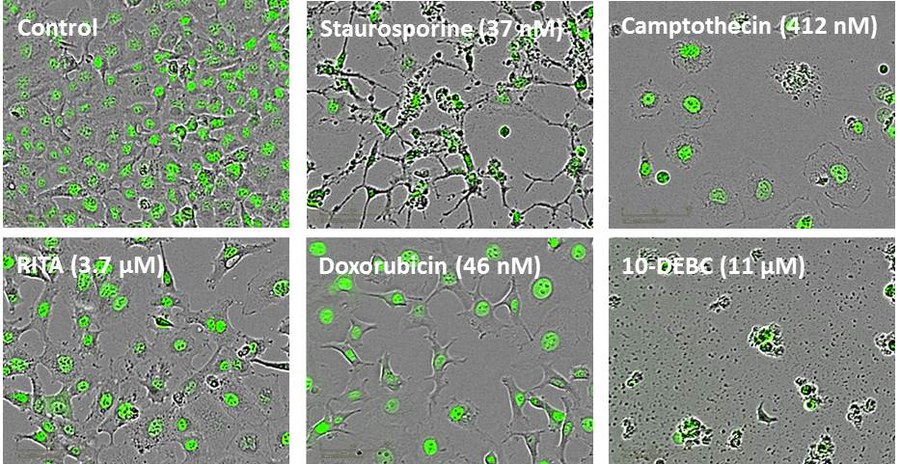
IncuCyte ZOOM® ‘blended’ phase contrast/fluorescence images (10x) of HT-1080 NucLight Green cells treated with different test compounds as labelled. Images were taken 24h post compound treatment. Note the reduction in total cell number for each treatment compared to the vehicle control, and the profound differences in cell morphology.
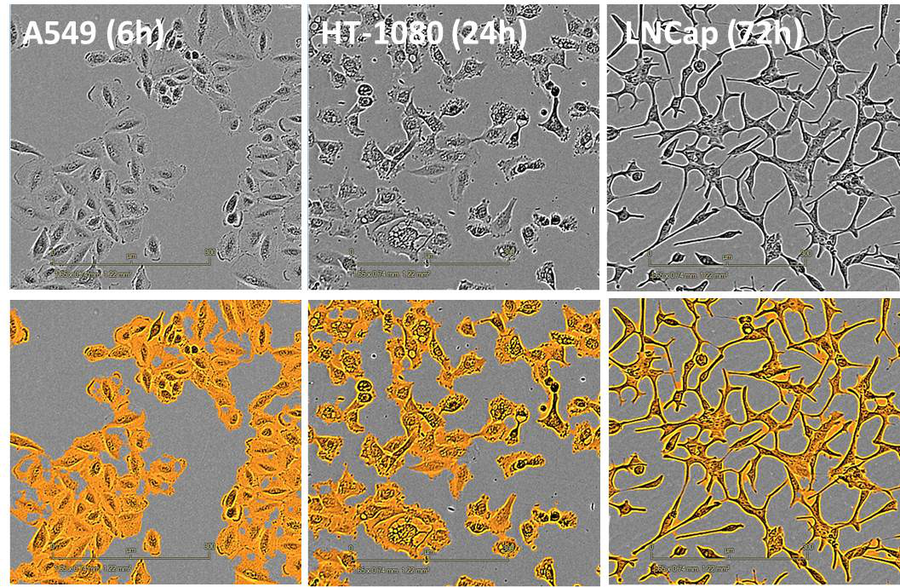
IncuCyte ZOOM® HD-phase contrast images (10x) of A549 human lung carcinoma, HT-1080 human fibrosarcoma and LNCap cells shown without and with confluence mask overlaid in orange. Note the accurate confluence masking of all three cells types which have very different morphologies.
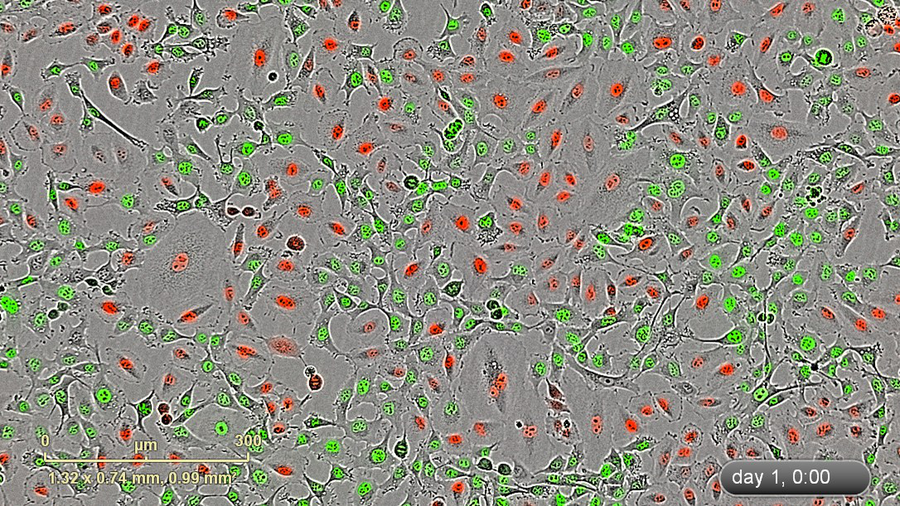
IncuCyte ZOOM® blended HD-phase contrat/fluorescence image (10x) of a mixed stable population of HT-1080 NucLight Green and A549 NucLight Red cells.
Migration & Invasion
Migration & Invasion
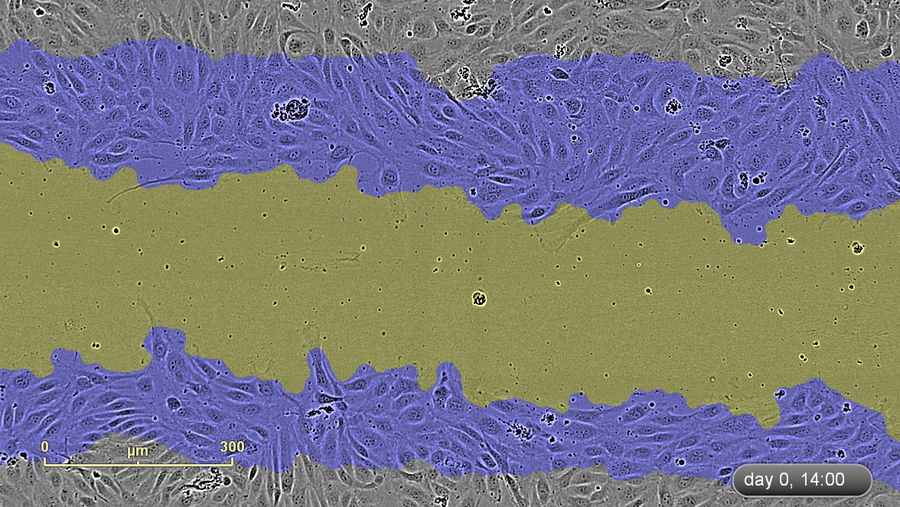
IncuCyte ZOOM® HD-phase contrast image (10x) at 14h post wounding of migrating HUVECs. The initial wound ‘mask’ generated with the analysis algorithm is overlaid (blue areas) and defines the initial wound boundaries at 0h. The wound mask at the 14h time point is shown in yellow.
Left: IncuCyte™ HD-phase contrast image of HT-1080 human fibrosarcoma cells migrating on Matrigel® (100 microgram/ml) 2h post wounding. Right: IncuCyte HD-phase contrast image of HT-1080 cells invading through a Matrigel® (8 mg/ml) matrix 24h post wounding. Note the differential cell morphology under the two conditions, with evidence of single cell invasion tracts through the Matrigel®.


Apoptosis & Cytotoxicity
Apoptosis & Cytotoxicity
IncuCyte ZOOM® HD-phase contrast and green fluorescence blended images (10x) of HT-1080 cells treated with Camptothecin (10 micro-molar) (left) and Mitomycin C (11 micro-molar) (right) in the presence of Caspase-3/7 reagent (Essen BioScience). The same number of cells were seeded per well (384-well plate) and achieved the same confluence (40%) at 0h prior to treatment. Images taken 48h post treatment.


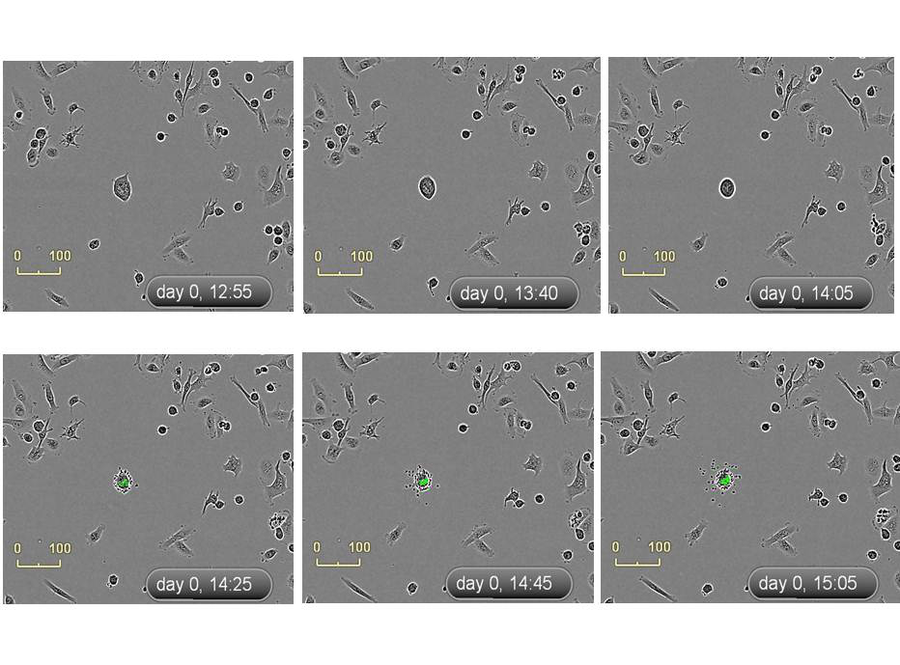
Time-lapse IncuCyte ZOOM® HD-phase contrast and green fluorescence blended images (10x) showing the effects of Camptothecin (10 micro-molar) on HT-1080 cells. Images taken in the presence of Caspase-3/7 reagent (Essen BioScience). Note the characteristic cell shrinkage, membrane blebbing and perturbance that accompanies the Caspase-3/7 fluorescent green signal which is not observed in the control (bottom right).


Effect of Taxol (33 nM) on MDA-MB-231 human breast adenocarcinoma cells. Time-lapse IncuCyte™ images taken in the presence of Caspase-3/7 reagent (Essen BioScience). Note the characteristic cell shrinkage, membrane blebbing and perturbance that accompanies the Caspase-3/7 fluorescent green signal.
IncuCyte ZOOM® HD-phase contrast, red and green fluorescence blended images (10x) of HT-1080 NucLight Red cells treated with Camptothecin (10 micro-molar) (top left), Cycloheximide (1 micro-molar) (top right), and Staurosporine (1 micro-molar) (bottom left) in the presence of YOYO-1. Control cells (1% DMSO) are shown (bottom right). The same number of cells were seeded per well (384-well plate) and achieved the same confluence (40%) at 0h prior to treatment. Images taken 24h post treatment. Note the cytotoxic effects of Camptothecin and Staurosporin (increase in the number of YOYO-1 green objects) in contrast to the cytostatic effect of Cycloheximide (reduction in the number of red objects) compared to the contol.


Angiogenesis
Angiogenesis
Vascular tube formation induced by Vasoactive Endothelial Growth Factor (VEGF) in PrimeKit HUVEC and human dermal fibroblast co-culture model. IncuCyte™ (10x) fluorescence image of VEGF (4 ng/ml) induced vascular structures.

Vasoactive Endothelial Growth Factor (VEGF) induced vascular tubes in StemKit Endothelial Colony Forming Cell & Adipocyte Derived Stromal Cell model. IncuCyte™ (10x) fluorescence image of VEGF (20 ng/ml) induced vascular structures at 96h post VEGF addition.

IncuCyte ZOOM® fluorescent images (10x) for VEGF (20 ng/ml) alone (left) and in the the presence of the microtubule disrupting agent, Combretastatin (3 nM) (right).


