Trapping Microbes: Live-Cell Visualization of NETosis
A new method to detect and quantify neutrophils’ defense mechanism, NETosis, using live-cell imaging
As first responders against pathogens, the neutrophils migrate from the blood to the infected site to engulf and kill bacteria. In 2004, it was discovered that neutrophils can also kill microbes extracellularly by releasing neutrophil extracellular traps (NETs).
Triggered under inflammatory conditions, NETs are formed and released to defend against microbes during a distinct form of programmed cell death known as NETosis, different from apoptosis and necrosis. Since their discovery, NETs have been implicated in numerous conditions such as cancer, diabetes, atherosclerosis, among others.
NETs consist of smooth filaments with stacked nucleosomes that trap bacteria. This processed chromatin bound to granular proteins bears a striking morphology compared to other filamentous structures, making NETs easily differentiable in electron microscopy.
The use of electron microscopy or end-point fluorescence microscopy to detect NETosis is time-consuming and laborious, often requiring ~2 days to process, but only revealing data at a certain end point. Visualizing the NETs in action, in real time, and quantifying them can provide insights into their biology that end-point-based assays can’t provide.
The NETosis live-cell assay
In a new application method, Sartorius describes how live-cell imaging can be employed to document NET formation, quantify NETs and understand the mechanism of NETosis. Plus, live imaging enables capture of the different stages of NETosis, such as swelling and decondensation of nuclei, followed by NET release.
NETosis Assay Workflow:
- Seed cells in the presence of reagents, for example, the Cytotox Green reagent that quantifies dead cells
- Add NETosis inhibitors
- Stimulate NET formation using the chosen method (for example, by adding PMA)
- Place into IncuCyte and rapidly scan under phase contrast and fluorescence channels

Assay workflow for live cell detection and quantification of NETosis using the IncuCyte.
Download the full method here.
Visualizing NETosis in real time
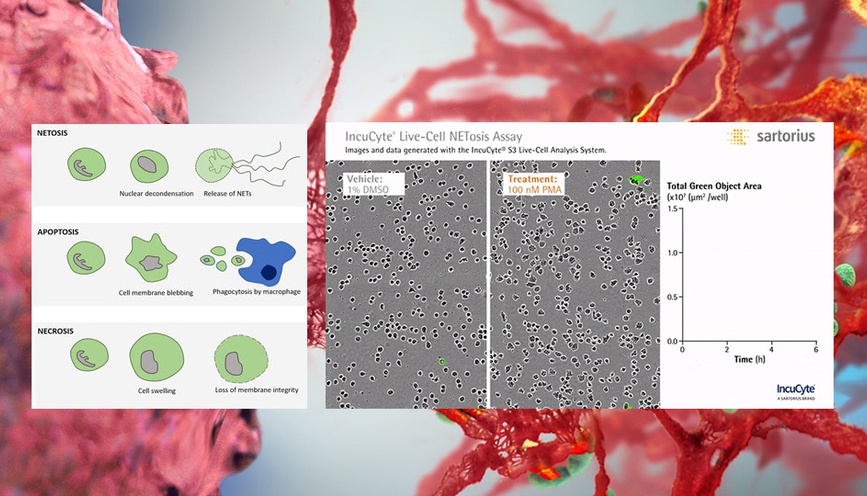
In an assay with HL-60 cells differentiated into neutrophil-type cells, NETosis was triggered by adding PMA. NETosis is detected and quantified using live-cell imaging with phase contrast and fluorescence measurements.

As a result of NETosis, the nuclear contents are released into the plasma membrane. This DNA binds to the IncuCyte Cytotox Green Reagent, producing fluorescence that can be measured. The morphology of NETosis, i.e. the nuclear decondensation and membrane compromise, can be captured over time in the phase contrast images of the cells.

Case study: Identification of NETosis fingerprint using IncuCyte
In the 2017 Journal of Immunology publication, Gupta et al. report using live-cell imaging for capturing and quantifying NETosis, as well as differentiating it from apoptosis and necrosis. The authors characterize the unique NETosis-related morphological changes, i.e. loss of nuclear lobulation, nuclear decondensation and membrane compromise, as the NETosis fingerprint.
Using phase contrast images to study morphology, red dye to stain and count nuclei, and the SYTOX Green to label dying cells, they set up a method to visualize NETosis in cultured neutrophils using the IncuCyte. NETosis was detected and measured by an increase in nuclear diameter (due to chromatin decondensation), a decrease in the intensity of the nuclear dye and eventual staining of the nuclear content with the SYTOX Green.
NETosis versus apoptosis and necrosis
By examining morphology in real time using phase contrast mode, coupled with fluorescence to count nuclei and measure cell death, the authors were able to distinguish the different mechanisms of cell death using the IncuCyte.
Upon pharmacological stimulation, the kinetics of cell death for NETosis differed from apoptosis and necrosis. Plus, morphological cues helped tell the different mechanisms apart. The morphological differences between NETosis, apoptosis and necrosis, as observed by Gupta et al. are summarized below:

Automated imaging eliminates selection bias
By using the IncuCyte to visualize neutrophil cell death, it’s possible to generate kinetics data in real time, apply the same image analysis settings to all experiments and eliminate selection bias for morphological analysis. The live imaging feature documents a time course of cellular events as against the conventional methods employing only one end time point. Plus, the ability to perform experiments in a 96-well plate offers a high-throughput capacity to study NETosis under different conditions.
The live, time-lapse imaging of neutrophil biology serves as a powerful tool to gain insights into how neutrophils defend us against pathogens, with applications extending to translational projects.

Morphological differences in the different forms of neutrophil cell death: NETosis, apoptosis and necrosis.
Learn more about the NETosis live-cell assay in this downloadable method.
Article source: Select Science