Live Cell Morphometry using Principal Component Analysis
Cell morphology is one of the strongest indicators of cell health. Biologists spend huge amounts of time examining cells under microscopes, making qualitative assessments of their samples. Do they look as they should? Have they adhered to the tissue culture surface, are they of the expected size and shape? These observations inform the decisions that are then made, either to proceed with a workflow that uses cells as the primary component, or to source a new batch of cells. However, there is no current consensus on exactly how cell morphology should be quantified.
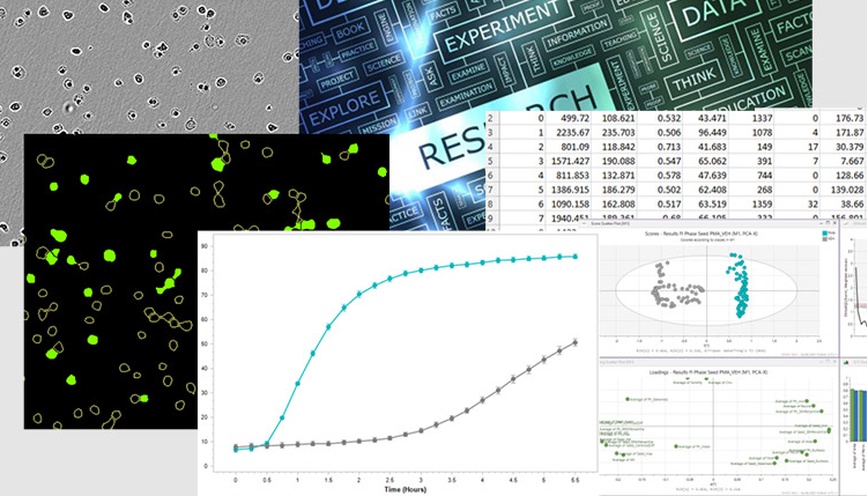
Incucyte® Live-Cell Analysis Systems enable cells to be visualized from within an incubator over long periods of time. Instead of qualitatively assessing cells which have been taken out of their native environment onto a lab bench, live-cell analysis enables researchers to both observe and quantify their cells in a controlled, optimized environment over time without perturbance. Integrated software identifies and segments individual cells from which metrics can be extracted relating to the shape and fluorescence of every cell in the field of view.

Incucyte® cell by cell segmentation. After image acquisition, integrated software automatically segments individual cells in the field of view. This segmentation yields metrics relating to cell shape including aspect ratio (ratio of length to width), roundness, and perimeter length. These variables can be analyzed individually or summarized using MVDA.
However, the multitude of ways in which a cell can change shape, make it difficult to rely on a single metric for a true reflection of cell health. If the area of a cell decreases is it because it is dividing, dying, or simply doesn’t have enough space? We rely on a combination of multiple metrics to provide context. Multivariate data analysis (MVDA) is a useful technique for using all the available information for each cell and facilitates interpretation of complex cell imaging datasets.
SIMCA® is a software package providing tools for MVDA of complex datasets and enables results to be visualized and analyzed. Combining these tools with data from cellular image analysis, has created a streamlined workflow in which large live-cell imaging datasets can be distilled into meaningful information. In particular, principal component analysis clusters cells that have a similar shape and enables cell morphologies to be identified in an unsupervised and unbiased manner.

Sartorius live-cell imaging and multivariate analysis combined workflow. The Incucyte® Live-Cell Analysis System automatically acquires HD Phase and fluorescence images from within a cell culture incubator. Integrated software segments cells and performs univariate analysis of fluorescence metrics over time. Metrics derived from segmented cells can be additionally analyzed using MVDA within SIMCA® software package.
Cell morphology is highly diverse
Mammalian cell morphology varies according to the source and function of the cells. Fibroblasts, a component of connective tissue, tend to appear long and flat while monocytes which circulate in blood are very small, circular and textured. Images of a wide range of cell types were acquired in the Incucyte® Live Cell Analysis System and segmented using integrated cell-by-cell software. Applying principal component analysis (PCA) to morphological descriptors of cells yields score and loading plots, which enable the shape of different cell types to be directly compared. To facilitate analysis of whole cell populations, the mean values for each metric at a single timepoint was used.

Principal component analysis enables diverse cell morphologies to be quantified. Images of different cell types at approximately 50% confluence were acquired in the Incucyte® Live-Cell Analysis System, and cells were segmented using integrated the cell by cell software module. Yellow bars indicate 200 µm. The blue circle encloses non-adherent cell types. Metrics describing individual cells were derived from the segmentation and input into SIMCA® software to perform principal component analysis. The highest loadings are indicated in teal text within their respective quadrants.
In general, the first component (PC1, horizontal axis) separates adherent and non-adherent cells. Non-adherent cell types cluster to the left side of the plot (within the indicated blue circle), while adherent cells – more diverse in nature – are distributed throughout the upper and lower right-hand quadrants. An exception is noted in the case of AU565, a breast cancer cell line which adheres to tissue culture plastic but has morphological features similar to non-adherent types (small area, highly round). Images of cells confirm the loading values for the various cell types. THP-1 monocytes are placed in the bottom left quadrant where the loading indicates the influence of metrics describing roundness, circularity and solid boundaries. In contrast, the top right quadrant contains CCD1086Sk fibroblasts which have a large area, long outer perimeter and high aspect ratio.
This type of quantification can assist with cell quality control both to identify potential cross-contamination of cell types, and to ensure that a cell line has consistent properties over increasing rounds of subculture. Cell morphology is also compared before and after transfections to confirm that the genetically modified cells are consistent with the parental line. Severe alterations in cell morphology after transfection, can indicate that undesired side-effects have taken place, which may alter the function of the cell.

Cell clones have varied morphology. PCA biplot shows three of the clones have different morphology to the parental (WT) line (A). Images of the cells reflect this quantification (B). Her2 expression was measured using Incucyte® FabFluor-488 labelled anti-Her2 and was observed to be highest in clone 6 (C).
Ovarian cancer cell line SKOV3 has a heterogeneous morphology, ranging from elongated and textured to flat, transparent cells. The parental line (SKOV3 WT) underwent rounds of clonal selection to enhance expression of surface marker Her2. After selection, the clones were observed to have different morphologies which were then quantified using PCA. The features of clone 3 (C3) are dominated by phase brightness and texture, Clone 4 (C4) contains more rounded and circular cells, while clone 6 (C6) have both higher texture and aspect ratio. Clone 5 (C5) clusters very closely with the WT line indicating similarity. Live cell immunocytochemistry indicated that clone 6 displayed increased Her2 expression.
Dynamic morphology changes analyzed through time
Cell morphology can change for a variety of reasons. As their confluence (% coverage of a field of view) increases, some types of cells will crowd together becoming smaller and more homogeneous in size and shape. Environmental or chemical perturbations can initiate sequences of events which affect the structural components of the outer cell boundary, causing blebbing, rounding or other unusual appearances. Perhaps the greatest alteration in adherent cell shape is observed during cell death – regardless of the initial morphology a dying cell will assume a small, circular, and highly textured phenotype.

Analysis of cell morphology over time. The morphology of healthy growing cells (vehicle control, VEH, grey), arrested cells (cytostatic compound cycloheximide, 1 µM CHX, pink) and dying cells (cytotoxic compound camptothecin, 10 µM CMP, teal) were quantified using principal component analysis and compared on a PCA score plot (A). Time is indicated by circle size (smallest circle corresponds to 0h, largest to 72h). Overlay of vehicle cell confluence and change in PC1 over time (B) indicate that as confluence reaches a plateau at approximately 36h, the cell morphology begins to alter. Overlay of PC1 and caspase activation (green fluorescence intensity) in CMP-treated cells show alteration in morphology after 20h when pro-death enzymes begin to activate.
To examine changes in cell shape over time, A549 cells were treated with a cytostatic compound (cycloheximide, CHX; inhibits cell growth), a cytotoxic compound (camptothecin, CMP; induces cell death) or left untreated (vehicle control, VEH). Cell morphology was analyzed using principal component analysis. Arrested cells which do not increase in confluence displaying very little change in morphology over time (CHX, pink), while those that could multiply without perturbance (VEH, grey) showed more alteration over the same three-day period. An overlay of PC1 score and confluence over time indicate that in vehicle control cells, the largest changes occur after 36h when confluence reaches a plateau. As cell-cell contacts increase, the cells shrink and crowd together. Dying cells (CMP, teal) rapidly alter their shape in a different manner and the timeframe of this change corresponds to the increase in activation of the pro-death Caspase enzymes (increasing green fluorescence intensity of Caspase 3/7 reagent).
Label-free quantification of cell death
Efficacy of a cytotoxic compound is often measured by applying different concentrations of the compound to cells in the presence of fluorescence reagents which identify cell death. However these reagents can fail to identify non-toxic, off-target effects. By directly examining the change in morphology, compound efficacy can be calculated, and additional information obtained on the effect of non-toxic compound concentrations.

Label-free quantification of cell death. A549 cells were treated with increasing concentrations of cytotoxic compound camptothecin (CMP, 0.16 – 10 µM, grey, time is indicated by increasing size of circle from 0h to 72h). The greatest variance in morphology is between live (teal) and dead cells (10 µM, 72h) and is represented by separation along principal component 1 (horizontal axis, A). The lowest concentration of CMP (0.16 µM, pale grey) is not considered cytotoxic however these points cluster separately from both live and dead cells with a higher principal component 2 score (vertical axis, A). Plotting PC1 score and Caspase 3/7 (cell death fluorescent reagent) at 72h indicates similar efficacy with EC50 (PC1) = 0.8 µM and EC50 (Caspase) = 1.2 µM (B).
Camptothecin is a known cytotoxic compound which is used to induce cell death in a wide range of cell types. However at low concentrations it can induce cell cycle arrest and senescence which are not detected using cell viability reagents. By measuring total morphology with PCA, both the senescent and dead cell phenotypes are detected, and quantification of compound efficacy using the PC1 score is comparable to the use of caspase apoptosis detection reagent.
The ability to quantify total cell morphology from microscopy images is a huge untapped resource of data. The use of multivariate analysis yields a thorough summary of cell shape, combining multiple different aspects such as roundness, solidity and outer perimeter length. This enables users to identify phenotypes of interest which are not accessible using a single metric (area or fluorescence). The Incucyte® Live-Cell Imaging System is particularly suited for morphological analysis since cells are maintained in their optimal culture environment, and images are continuously acquired without perturbing the culture vessels. Cells are automatically segmented using integrated software, and metrics for each cell obtained. Combining live-cell imaging with MVDA has created a powerful workflow for analysis of total cell morphology through time.
A patent has been applied for the method of classification of cells by morphology using multivariate analysis.