- Home
- Applications
- Measure Cell Migration and Chemotaxis in Real Time
- Incucyte® Chemotaxis Assay
- Chemotaxis Data Processing Tech Note
TECH NOTE
Chemotaxis Data Processing: Creating an Analysis Job
Data processing analyzes and summarizes qualitative images into quantitative data. You will be required to define the analysis parameters (phase and/or fluorescence) for your assay plate. This task can be completed by using the Analysis Job Utilities found in the upper right-hand corner of the Vessel View window. The basic workflow of setting up an analysis job, from image collection to analysis launch, is represented below. Information icons are found throughout the software. Mouse over the information icons to find detailed information and useful tips.
Workflow
Use the links below to navigate to the desired section of this technical note.
Phase
Fluorescence
Step 1: Create an Image Collection
In the Vessel View window, review the scanned vessel and find representative images to add to an Image Collection.
- Open the Vessel View and select 2-4 representative images of your cells. Once a representative image is chosen, click the “Create or Add to Image Collection” link under Analysis Job Utilities in the top-right corner (refer to Figure 1).
- The “Add Current Image to Image Collection” window opens. You can create a Chemotaxis Image Collection under two Analysis Job Types using the drop-down menu: Chemotaxis Migration (Top/Bot) or Chemotaxis Migration (Top Only).
Chemotaxis Migration (Top/Bot) analysis enables you to analyze both the top side and bottom side of the ClearView membrane, in order to quantify cells that have migrated and adhered to the bottom-side of the membrane.
Chemotaxis Migration (Top Only) analyzes cells that are on the top-side of the membrane. Although both sides of the membrane are imaged and available for viewing, data processing is only completed on images of top-side of the membrane. We have found that this analysis job is necessary when using nonadherent cell types such as neutrophils and T cells. - Use the radio buttons to add the image to an Existing Collection or create a New Collection.
- Select the Required Image Channels that will be used to test the desired processing definitions (phase and/or fluorescence).
- Once all fields are completed, click the “OK” button. Each Image Collection should be limited to 2-4 representative images.
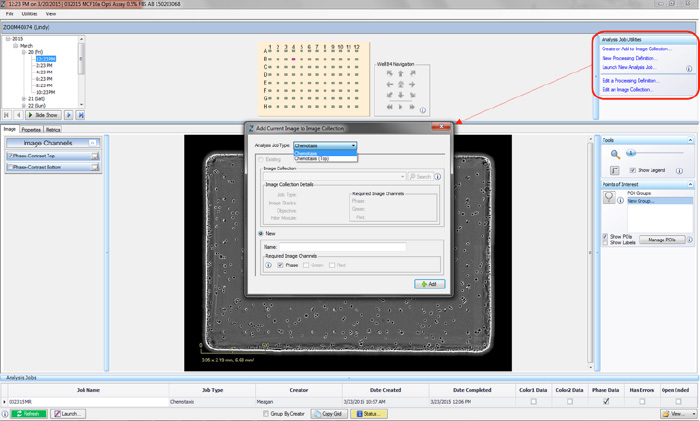
Figure 1: Creating an Image Collection
Step 2a: Create a New Phase Processing Definition – Chemotaxis Migration (Top/Bot) Analysis Job Type
A processing definition is a stored set of parameters that completely specifies how to process acquired images. Outlined below are the steps required to perform a phase-only analysis.
- Once an Image Collection is saved, start a New Processing Definition by clicking on the “New Processing Definition” link within the Vessel View (found just underneath the “Add to Image Collection” link).
- A new window will open (Add New Processing Definition) that contains a drop-down menu allowing you to select the Image Collection that you would like to use to test your processing definition on. You can also use the “Search” button to locate an Image Collection.
- Click the “Continue” button. An un-previewed Chemotaxis Migration (Top/Bot) Processing Definition Editor will open (refer to Figure 2), displaying the “Preview Image Collection” that you have chosen.
- Give the phase analysis an Object Name. For example, “MCF10a.”
- Click the “Preview” button. NOTE: The best way to begin setting up the Processing Definition is to use the preset values already contained within the Processing Definition Editor.
- Make sure the “Phase Mask Top” and/or “Phase Mask Bottom” box is checked and evaluate your phase segmentation (refer to the blue rectangle in Figure 2). NOTE: The Chemotaxis Top/Bot Processing Editor applies the same set of analysis parameters to both the top-side and bottomside of the membrane.
- Toggle between the Phase-Contrast Top and Phase-Contrast Bottom image channels (refer to the red rectangle in Figure 2) to evaluate if the segmentation appropriately masks cells located on the bottom of the membrane as “Phase Mask Bottom” objects.
- To refine the mask, adjust the “Seed Threshold” Parameter (refer to the black rectangle in Figure 2) slider. The “Seed Threshold” should be used to find the smallest threshold that masks a portion of each cell without including the background.
- Once the “Seed Threshold” parameter is defined, fine-tune masking using the “Grow Threshold” to expand the seed mask to cover more cell area. Click “Preview.”
- Use the “Pore Size Adjustment” to adjust the pore mask and to avoid masking phase image artifacts around the pores as cells.
- Use the “Cleanup” options to further optimize your mask.
- The “Processing Keep-out” parameter is used to eliminate the well edges from the phase-contrast analysis mask.
- Once you have previewed the complete Image Collection and are satisfied with the parameters, save the Processing Definition (File >Save) and give it a unique name.
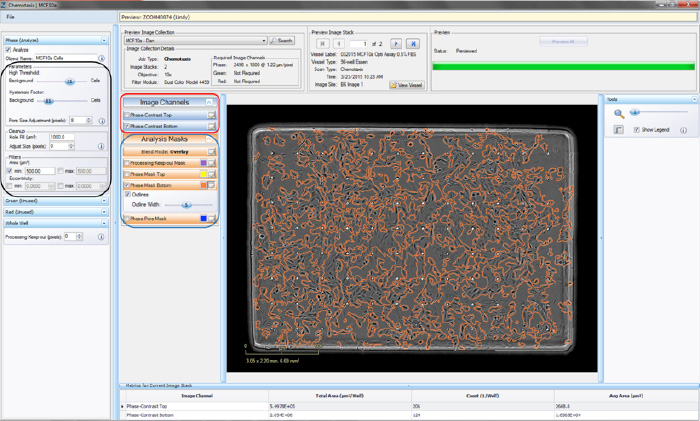
Figure 2: Chemaxis Migration (Top/Bot) Processing Definition Editor - PHASE
Step 2b: Create a New Phase Processing Definition – Chemotaxis Migration (Top Only) Analysis Job Type
A processing definition is a stored set of parameters that completely specifies how to process acquired images. Outlined below are the steps required to perform a phase-only analysis
- Once an Image Collection is saved, start a New Processing Definition by clicking on the “New Processing Definition” link within the Vessel View (found just underneath the “Add to Image Collection” link).
- A new window will open (Add New Processing Definition) that contains a drop-down menu allowing you to select the Image Collection that you would like to use to test your processing definition on. You can also use the “Search” button to locate an Image Collection.
- Click the “Continue” button. An un-previewed Chemotaxis (Top Only) Processing Definition Editor will open (refer to Figure 3), displaying the “Preview Image Collection” that you have chosen.
- Choose a “Training Image Collection” (black rectangle in Figure 3) to determine the parameters that will diff erentiate between the “Background” and the “Cells” within the phase image. The “Training Image Collection” should be the Image Collection that you made containing 2–4 representative images of your cells of interest.
- Give the phase analysis an Object Name. For example, “PMNs.”
- Click the “Preview” button. NOTE: The best way to begin setting up the Processing Definition is to use the preset values already contained within the Processing Definition Editor.
- Make sure the “Phase Mask Top” box is checked and evaluate your phase segmentation (refer to the blue rectangle in Figure 3).
- Toggle between the Phase-Contrast Top image channel and “Phase Mask Top” analysis mask (refer to the red rectangle in Figure 3) to evaluate if the segmentation appropriately masks cells located on the membrane as “Phase Mask Top” objects.
- To refine the mask, move the “Segmentation Adjustment” slider more toward “Background” to eliminate background texture and debris, or toward “Cells” to include more cell area, then click “Preview.”
- Use the “Cleanup” options to further optimize your mask.
- The “Processing Keep-out” parameter is used to eliminate the well edges from the phase-contrast analysis mask.
- Once you have previewed the complete Image Collection and are satisfied with the parameters, save the Processing Definition (File > Save) and give it a unique name.
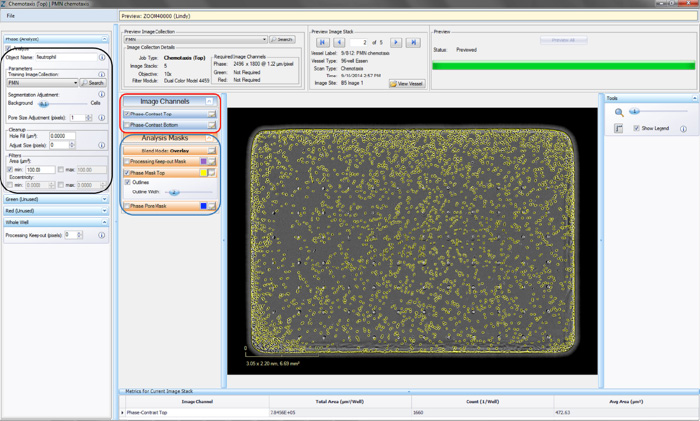
Figure 3: Chemotaxis Migration (Top Only) Processing Definition Editor - PHASE
Step 2c: Create a New Fluorescence Processing Definition – Chemotaxis Migration (Top/Bot) Analysis Job Type
A processing definition is a stored set of parameters that completely specifies how to process acquired images. Outlined below are the steps required to perform a fluorescence-only analysis.
- Once an Image Collection is saved, start a New Processing Definition by clicking on the “New Processing Definition” link within the Vessel View (found just underneath the “Add to Image Collection” link).
- A new window will open (Add New Processing Definition) that contains a drop-down menu allowing you to select the Image Collection you would like to use to test you processing definition on. You can also use the “Search” button to locate an Image Collection.
- Click the “Continue” button. An un-previewed Chemotaxis Migration (Top/Bot) Processing Definition Editor will open (refer to Figure 4), displaying the “Preview Image Collection” that you have chosen.
- Check the boxes which you wish to analyze. For instance, if you are only analyzing Red data, it is unnecessary to check the Phase box.
- Assign “object name,” for example, “nuclei” (refer to the black rectangle in Figure 4).
- Click the “Preview” button. NOTE: The best way to begin setting up the Processing Definition is to use the preset values already contained within the Processing Definition Editor. NOTE: Once the image is previewed, a background subtracted image is formed and displayed in a new tab under the available color image channels. Use the “Original” and “Background Subtracted” tabs to compare between the twoimages. Only the “Background Subtracted” image will be used for segmentation.
- Make sure that both the correct fluorescence image channel box and the “Mask” box are checked and evaluate your mask (refer to the blue rectangle in Figure 4).
- Toggle between the Fluorescent Top and Fluorescent Bottom image channels as well as the Phase-Contrast Top and Phase-Contrast Bottom image channels (refer to the red rectangle in Figure 4) to evaluate if the segmentation appropriately masks objects located on the membrane as “Fluorescent Object Mask Bottom” objects.
- To refine the mask, adjust the “Seed Threshold” Parameter (refer to the black rectangle in Figure 4). The “Seed Threshold” should be used to find the smallest fluorescence threshold that masks off portions of the cells without including the background.
- Once the “Seed Threshold” parameter is defined, fine-tune masking using “Grow Threshold” to expand the seed mask to cover more cell area. Click “Preview.”
- Use the “Blend Mode,” “Weight,” “Outlines,” and “Color” selection options found within the image channels and analysis masks to help you to assess the mask. Changing these will not aff ect the processing definition.
- If necessary, increase the threshold to eliminate masking of background or decrease the threshold to include dimmer objects. Click “Preview” to assess the changes.
- Further refine the mask by modifying the Edge Split, Cleanup, and Filters.
- The “Processing Keep-out” parameter is used to eliminate the well edges from the analysis.
- Once you have previewed the complete Image Collection and are satisfied with the parameters, save the Processing Definition (File > Save) and give it a unique name.
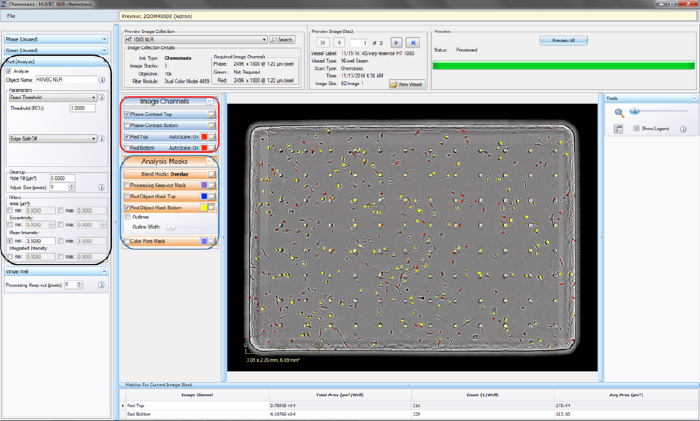
Figure 4. Chemotaxis Migration (Top/Bot) Processing Definition Editor - FLUORESCENCE
Step 2d: Create a New Fluorescence Processing Definition – Chemotaxis Migration (Top Only) Analysis Job Type
A processing definition is a stored set of parameters that completely specifies how to process acquired images. Outlined below are the steps required to perform a fluorescence-only analysis.
- Once an Image Collection is saved, start a New Processing Definition by clicking on the “New Processing Definition” link within the Vessel View (found just underneath the “Add to Image Collection” link).
- A new window will open (Add New Processing Definition) that contains a drop-down menu allowing you to select the Image Collection you would like to use to test your processing definition on. You can also use the “Search” button to locate an Image Collection.
- Click the “Continue” button. An un-previewed Chemotaxis Migration (Top Only) Processing Definition Editor will open (refer to Figure 5), displaying the “Preview Image Collection” that you have chosen.
- Check the boxes that you wish to analyze. For instance, if you are only analyzing Red data, it is unnecessary to check the Phase box.
- Assign “object name,” for example, “nuclei”.
- Parameters can be adjusted to mask objects in three different ways (refer to the black rectangle in Figure 5); adaptive segmentation, fixed threshold or top-hat subtracted. Top-Hat is recommended in order to eliminate effects from the fluorescent background.
- Click “Preview Current” to assess the changes on the current image only, or “Preview All” to apply the changes on all the images in your collection. NOTE: If using Top-Hat, once the image is previewed, a background subtracted image is formed and displayed in a new tab under the available color image channels. Use the “Original” and “Background Subtracted” tabs to compare between the two images. Only the “Background Subtracted” image will be used for segmentation (refer to the red rectangle in Figure 5).
- Make sure that both the correct fluorescence image channel box and the “Mask” box are checked and evaluate your mask (refer to the blue rectangle in Figure 5).
- Toggle between the Fluorescent Top and Fluorescent Bottom image channels as well as the Phase-Contrast Top and Phase-Contrast Bottom image channels (refer to the red rectangle in Figure 5) to evaluate if the segmentation appropriately masks objects located on the membrane as “Fluorescent Object Mask Bottom” objects.
- Use the “Blend Mode,” “Weight,” “Outlines,” and “Color” selection options found within the image channels and analysis masks to help you to assess the mask. Changing these will not aff ect the processing definition.
- If necessary, increase the threshold to eliminate masking of background or decrease the threshold to include dimmer objects. Click “Preview” to assess the changes.
- Further refine the mask by modifying the Edge Split, Cleanup, and Filters.
- The “Processing Keep-out” parameter is used to eliminate the well edges from the phase-contrast analysis mask.
- Once you have previewed the complete Image Collection and are satisfied with the parameters, save the Processing Definition (File > Save) and give it a unique name.
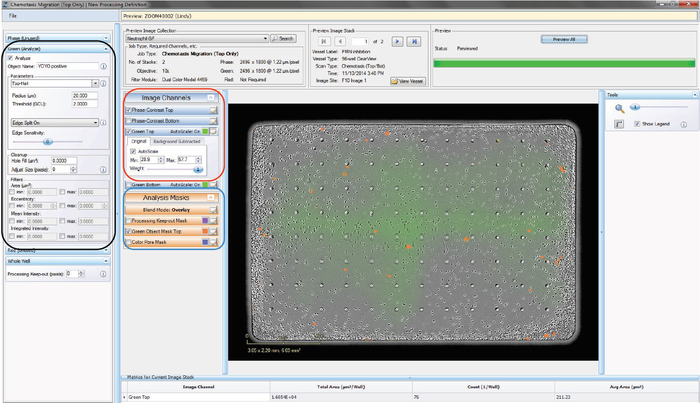
Figure 5. Chemotaxis Migration (Top Only) Processing Definition Editor - FLUORESCENT
Step 3. Launch a New Analysis Job
Once a processing definition has been defined for an assay, cell type, or magnification, Analysis Jobs can be performed.
- Open the Vessel View for the vessel you wish to analyze.
- Click “Launch New Analysis Job” under “Analysis Job Utilities.”
- Select “Chemotaxis Migration (Top/Bot)” (for top and bottom membrane analysis) or “Chemotaxis Migration (Top Only)” (topside analysis) for Job Type (refer to the red rectangle in Figure 6).
- Choose the Processing Definition you wish to use from the dropdown menu.
- Assign a unique name to the job.
- You may select a “Time Range,” “Single Time,” or “Open Ended” to analyze. NOTE: Because both the Chemotaxis Migration (Top/Bot) and Chemotaxis Migration (Top Only) analysis jobs include metrics for normalization of data based on the first processed image value, it is important to exclude any initial images that may have been acquired when condensation was present.
- Select the wells you wish to analyze and click “OK.”
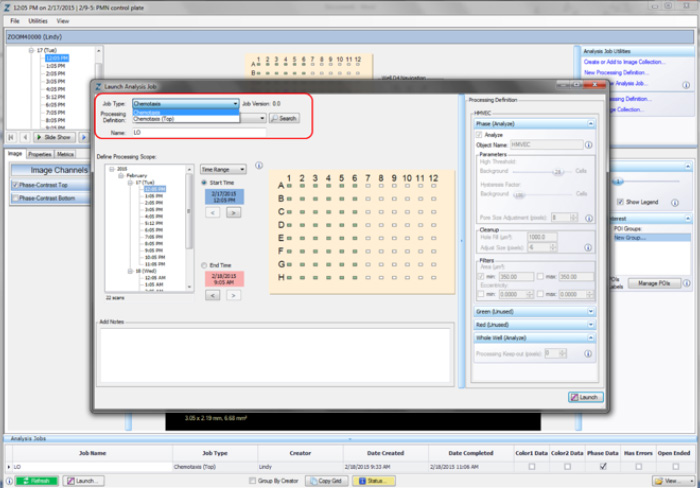
Figure 6: Launching an Analysis Job (Vessel View).
Chemotaxis Metrics
After your scanned images have been analyzed, they can be used to generate graphs of the selected metric over time. The IncuCyte™ graphing feature can be accessed in the Vessel View window by either selecting the “Graph” tab and then clicking on the “Graph/ Export” button, or by choosing the Graph/Export option from the Utilities pull-down menu.
No assay metrics will be available until an analysis job is complete and opened. Open the Analysis Job at the bottom of the Vessel View window (notice that the color banner at the top of the Vessel View window changes from blue to green).
Metrics available for graphing are the same for both Chemotaxis
Migration (Top/Bot) and Chemotaxis Migration (Top Only) and are
outlined in detail below.
NOTE: When using the Chemotaxis Migration (Top/Bot) Analysis Job
Type, you have the ability to generate graphs for both the top-side
and bottom-side of the ClearView membrane.
Phase Metrics
- Total Phase Object Area (μm2/well) –The total area of the objects in the well
- Total Phase Object Area Normalized to Initial Top Value – The total area of the objects in the well normalized to (divided by) the initial area
- Phase Object Count (1/well) – The number of objects per well Phase Object Count Normalized to Initial Top Value – The number of objects per well normalized to (divided by) the initial object count
- Avg Phase Object Area (μm2) – The average of the area of the objects
Fluorescence Metrics
- Object Count (1/well) – The number of objects per well
- Object Count Normalized to Initial Top Value – The number of objects per well normalized to (divided by) the initial object count
- Total Object Area (μm2/well) – The total area of the objects in the well
- Total Object Area Normalized to Initial Top Value – The total area of the objects in the well normalized to (divided by) the initial area
- Avg Object Area (μm2) – The average of the area of the objects

