- Home
- Applications
- IncuCyte® Phagocytosis Protocols
- IncuCyte® Phagocytosis Detailed Demonstration Protocol
IncuCyte® Phagocytosis Detailed Demonstration Protocol
Overview
The following protocol is a detailed worked example designed to enable the user to run a successful phagocytosis assay. It specifically describes the use of IncuCyte® Live-Cell Analysis System for monitoring bioparticle uptake in the presence of inhibitory agents in a single 96-well plate. In this example, the mouse macrophage cell line J774A.1 is used.
Materials
- Growing stocks J774A.1 WT cells
- Cell culture media + 10% FBS
- 96-well microplate (Corning® 3595)
- Cell scraper
- D-PBS (-/- Ca2+, Mg2+)
- Bath sonicator
Protocol
Day 0
- Remove a freshly confluent (~80%) T75 flask of J774A.1 cells from the tissue culture incubator and place within a sterile cell culture hood.
- Remove media and wash cells with D-PBS (10mL).
- Add 10 ml fresh cell culture media to flask and detach cells by scraping.
- Perform a cell count (e.g. trypan blue staining + haemocytometer).
- Dilute the cell suspension to 2 x10⁵ cells/mL in culture media.
- Using a multi-channel pipette seed cells (50 µL per well, i.e. 1 x10⁴ cells per well) into chosen wells of 96-well microplate.
- Exclude cells from at least 3 wells of the microtitre plate. These will serve as a negative control (- cells/+ bioparticles). To these wells add 50 µL media instead of cell suspension.
- Remove bubbles from all wells by gently squeezing a wash bottle (containing 100% ethanol with the inner straw removed) to blow vapor over the surface of each well. Keep the tip of the wash bottle approximately 5 cm from the media surface.
- Allow the cells to settle in the hood for 30 minutes before placing in incubator overnight.
Day 1
- In the IncuCyte® ZOOM software schedule 24 hour repeat scans every 15 minutes.
- Objective: Ensure desired objective is installed (10x or 20x).
- Vessel Type: Select Corning ® 3595 (96-well microtitre plate).
- Channel selection: Select ‘Phase’ and ‘Green’ (400 ms acquisition time). Note, if using red fluorescent bioparticles select ‘Red’ (800 ms acquisition time) instead of ‘Green’ channel.
- Scan mode: Select ‘Standard’ scan type and set ‘Scan Pattern’ to 1 (or 2) images per well.
- Prepare dilutions of inhibitory agents in assay media at 3x final assay concentration and warm by placing in a 37°C incubator.
- Remove bubbles from all wells.
- Remove the cell plate and compounds from the incubator and to each well add 25 µL of the desired compound.
- Replace cells in the incubator for desired incubation period.
- Prepare a suspension of IncuCyte® pHrodo® Bioparticles®:
- Resuspend lyophilised bioparticles in assay media to a concentration of 1 mg/mL.
- Transfer suspension to a glass vial and vortex thoroughly.
- Sonicate for minimum of 5 minutes until a homogeneous suspension is observed.
- Thoroughly mix the bioparticle suspension by vortexing and dilute bioparticles to 4x final assay concentration in cell media. Note the recommended final assay concentration is 10 µg per well.
- Immediately after dilution of the bioparticles, remove the cell plate from the incubator and add the bioparticle suspension to the cell plate using a multichannel pipette. Add bioparticles to the control wells which contain no cells.
- Exclude bioparticles from at least 3 wells of the plate which contain cells. This will serve as negative control (+ cells/- bioparticles). To these wells add 25 µL media instead of bioparticle suspension.
- Remove bubbles from all wells and place cells in IncuCyte® ZOOM.
- In the IncuCyte® ZOOM set scans to commence immediately and monitor increase in fluorescence.
Illustrative data

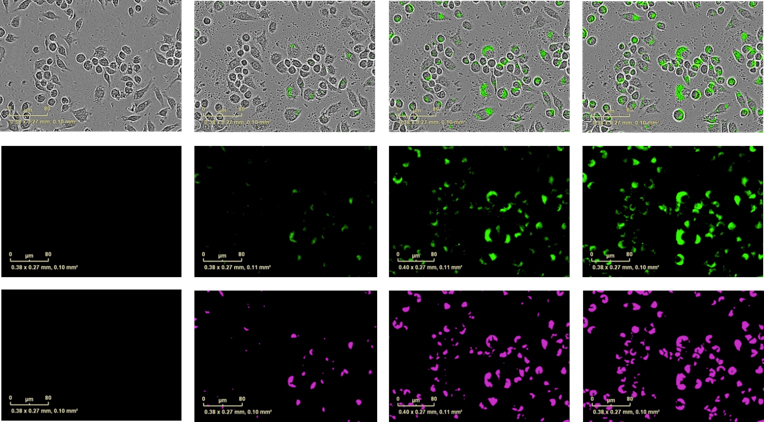
J774A.1 murine macrophage cell line were seeded at 1 x10⁴ cells/well and incubated with IncuCyte® pHrodo® Green E. coli Bioparticles® (10 μg/well). Exemplar data show blended images of phase contrast and green fluorescent images (top row), fluorescent images alone (middle row) at 0, 1 and 4 hours incubation time.
Bottom row shows the masked fluorescent area. Briefly, the IncuCyte® ZOOM software enables users to define a minimum fluorescence intensity threshold. Any fluorescent pixel which has an intensity above this threshold is considered to be above the signal-to-noise ratio and becomes ‘masked’. This masked area increases as more phagosomes engulf bioparticles and become fluorescent. Hence the metric ‘Total fluorescent object area’ is a useful surrogate for phagosome counting.

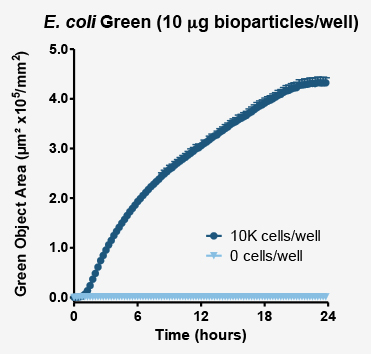
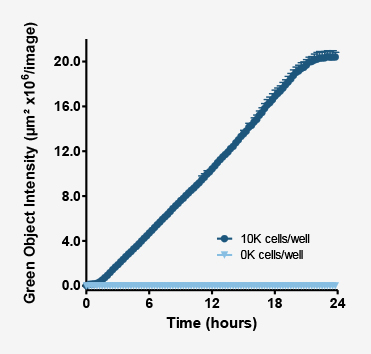
Above plot shows the increase in masked fluorescent object area (proportional to the number of phagosomes which have engulfed bioparticles). Fluorescence area and intensity increase where cells have been exposed to bioparticles (dark blue markers). In the absence of phagocytic cells (pale blue markers) no increase in fluorescence is observed.

As the phagosomes engulf bioparticles and become mature phagolysosomes, their pH continues to decrease. As this occurs the fluorescence intensity of the probe continues to increase.
Above plot shows the increase in intensity of fluorescent objects. This metric enables users to not only measure how many phagosomes have taken up bioparticles, but also measure their maturation.
Phase Metrics
Over time the number of phagocytosing cells increases, and cell proliferation can be quantified using the metric ‘Phase Object Confluence’: a measure of the area of field of view covered by cells.
To generate this metrics the user must create a Processing Definition suited to the cell type, assay conditions and magnification and then apply the Processing Definition to the data set as an Analysis Job.
- Follow the instruction provided within the ‘IncuCyte® ZOOM Confluence Processing Overview’ to (1) create an appropriate image collection including phase channel with which to (2) create a Processing Definition to mask cells using phase object analysis; (3) launch an Analysis Job to analyze images and produce metrics based on parameters contained within the saved Processing Definition.
On addition to the cells, bioparticles will be visible in phase images as fine granular material. In order to exclude these objects from the mask, use the Area Filter function when setting up the processing definition. By choosing a minimum area requirement, all particles defined as smaller than this area will be excluded from the mask.
The data can be exported into a third party data analysis program (e.g. Microsoft Excel) and increase in confluence plotted over time.
Fluorescence Metrics
As the cells engulf IncuCyte® pHrodo® Bioparticles®, the fluorescence intensity inside the cells increases. This can be reported in two ways: as an increase in fluorescence area (‘Total Object Area’); and as increase in intensity, integrated over the area of detectable fluorescence (‘Total Integrated Intensity’).
To generate these metrics the user must create a Processing Definition suited to the cell type, assay conditions and magnification and then apply the Processing Definition to the data set as an Analysis Job.
- Follow the instruction provided within the ‘IncuCyte® ZOOM Fluorescent Processing Overview’ Technical Note to (1) create an appropriate image collection including the fluorescence channel with which to (2) create a Processing Definition to mask cells using fluorescent object analysis; (3) launch an Analysis Job to analyze images and produce metrics based on parameters contained within the saved Processing Definition.
- To exclude background fluorescence from the mask, use the background subtraction feature in the Parameters drop-down menu. The feature ‘Top-Hat’ will subtract local background from brightly fluorescent objects within a given radius; this is a useful tool for analyzing objects which change in fluorescence intensity over time, as in this case.
- The radius chosen should reflect the size of the cells; in the illustrated data the radius chosen was 10 µm.
- The threshold chosen will ensure that objects below a fluorescence threshold will not be masked. To choose this threshold, examine the raw images of negative controls at a late time-point (where cells have engulfed bioparticles and become fluorescent). The threshold should exclude fluorescence from the negative control wells; in the illustrated data the threshold was 10 GCU.
- In this instance area filters should not be applied since non-engulfed bioparticles are non-fluorescent; additionally as the bioparticles enter phagosomes and fluorescence intensity begins to increase the fluorescence is punctate at early time-points.
